

Dense bundles of multicoloured fibres sweeping across a near-black ground
Week: Regression

Workshop 11: Regression in R

Modeling for System Improvement
Tim Fraser
Tim Fraser, PhD
Assistant Teaching Professor, Systems Engineering
Cornell University
SYSEN 5300: Systems Engineering & Six Sigma
for Design and Operation of Reliable Systems
Learning Outcomes
Target with an arrow in the bullseye
  • Risk Analysis with a particular emphasis on risk assessment and risk characterization. The key modeling tools we will study are how to conduct Failure Modes and Effects Analyses including the development of fault trees and event trees under uncertainty.
  • Modeling Reliability Modeling component and system reliability, including the use of physical acceleration models. Reliability is the ability of a system or component to perform its required function under stated conditions for a specified period of time. Reliability analysis is an element of risk analysis. In general risk analysis is substantially broader including explicit treatment of the consequences of different types of failures.
Learning Outcomes
Target with an arrow in the bullseye
  • Quality Control Six sigma and statistical process control for quality control and improvement. A key process in the operation of reliable systems is the development and effective use of mechanisms to detect when performance is deteriorating so that corrective action can be taken.
  • System Improvement Improvement and optimization of system design for reliability. This will lead us to study design of experiments and the estimation of response surfaces that can greatly catalyze innovation, problem solving, and discovery.

Today's Class

  • Reading Questions
  • Coding Demo
The big question:
As X increases, what happens to Y?
Animated scatterplot: a cloud of points shifts from a negative to a positive relationship as the line of best fit swings with it

Reading Questions


Workshop 11

Activity: Explain It

Please complete the following steps:
  1. Pick 2 reading questions from slides below.
  2. Copy the slide matching that function, and add it to our Slide Deck [Link]!
  3. Update it with your Group Number and your names.
  4. Fill in the slide with your answers to these questions.
  5. Take a screenshot of your slide and submit it in the CANVAS text submit box!
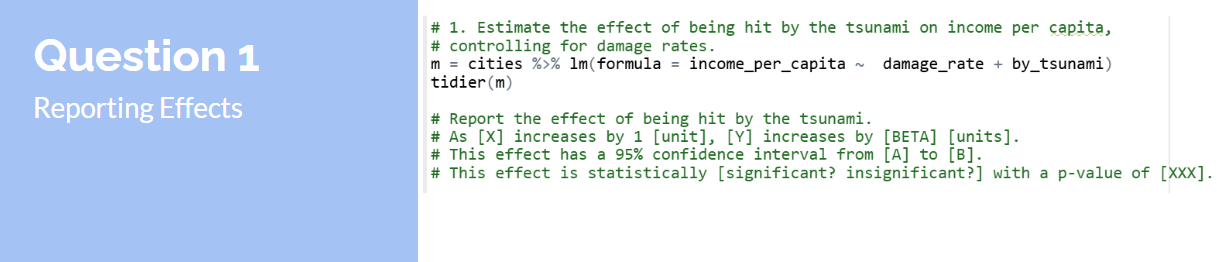
Question 1 card, Reporting Effects: estimate the effect of being hit by the tsunami on income per capita, controlling for damage rates, with m equals cities piped into lm of formula income per capita against damage rate plus by tsunami, then tidier of m; report the effect using the sentence frame as X increases by 1 unit, Y increases by BETA units, with a 95 percent confidence interval from A to B, statistically significant or insignificant with a p-value of XXX

• • •

Question 10 card, Intercept when using Categorical Variables: model the effect of each year on income; which year is not represented? The intercept represents that baseline category; cities dollar year piped into unique, then m equals cities piped into lm of formula income per capita against year; calculate the predicted income per capita from 2011 to 2017
Modeling Exercises
Load Data
library(dplyr)
library(readr)
library(broom)
library(texreg)
library(gtools)

cities = read_csv("workshops/jp_matching_experiment.csv") %>%
  # Tell R to treat year and pref as **ordered categories**
  mutate(year = factor(year),
         pref = factor(pref),
         by_tsunami = factor(by_tsunami, levels = c("Not Hit", "Hit")))

cities %>% glimpse()

You'll need these packages….

install.packages(c("dplyr", "readr", "broom", "texreg", "gtools"))
Modeling Exercises
Load Function
# Let's write a little tidier function..
tidier = function(model, ci = 0.95, digits = 3){
  model %>% # for a model object
    # get data.frame of coefficients
    # ask for a confidence interval matching the 'ci' above!
    broom::tidy(conf.int = TRUE, conf.level = ci) %>%
    # And round and relabel them
    reframe(
      term = term,
      # Round numbers to a certain number of 'digits'
      estimate = estimate %>% round(digits),
      se = statistic %>% round(digits),
      statistic = statistic %>% round(digits),
      p_value = p.value %>% round(digits),
      # Get stars to show statistical significance
      stars = p.value %>% gtools::stars.pval(),
      # Get better names
      upper = conf.high %>% round(digits),
      lower = conf.low %>% round(digits))
}

Coding Demo


Workshop 11